![]()
![]()
![]()
![]()
![]()
![]()
![]()
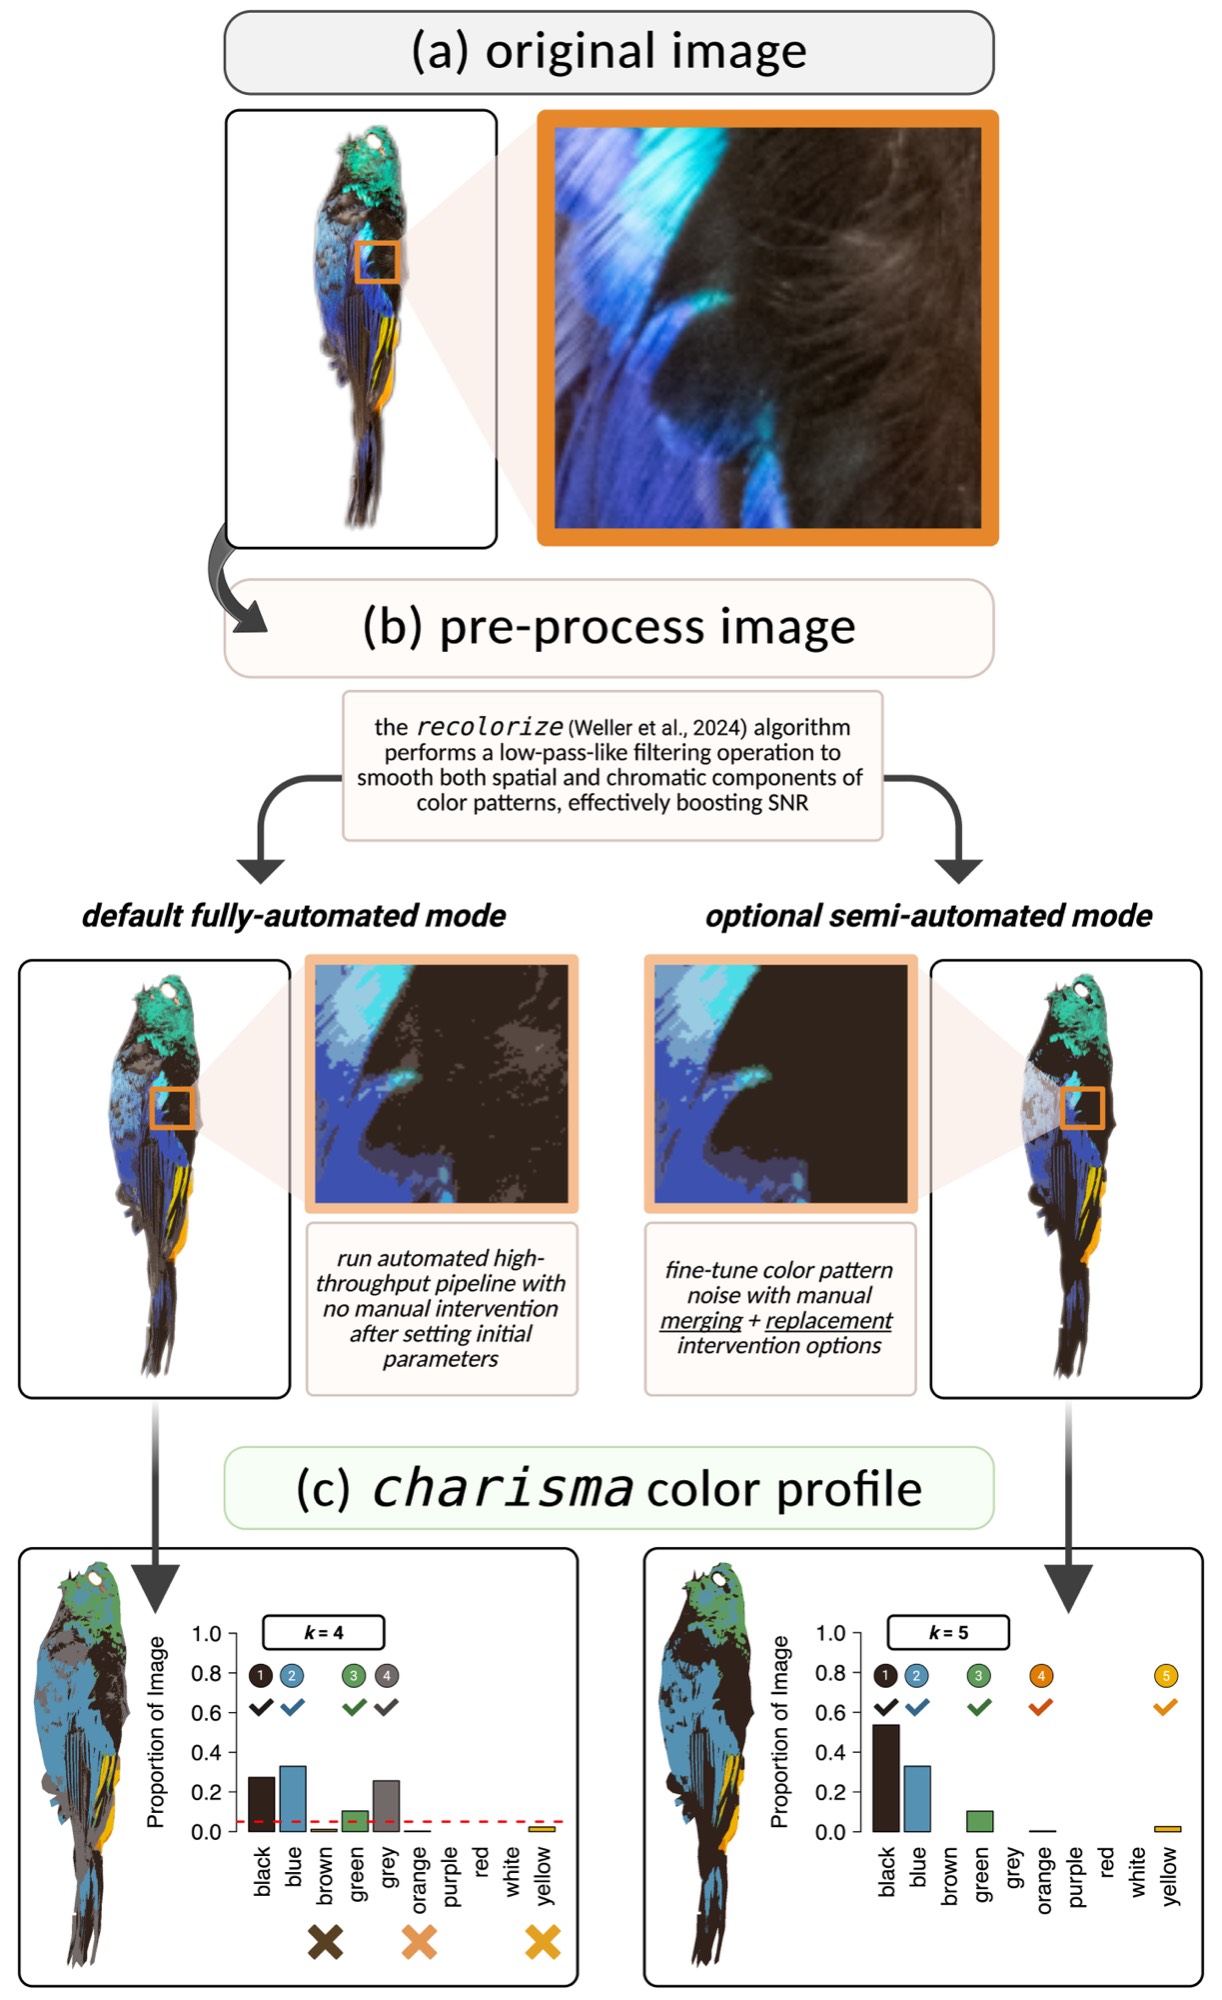
charisma provides a standardized, reproducible framework for characterizing discrete color classes in digital images of biological organisms.
charisma automatically classifies colors in images into
10 human-visible categories using a biologically-inspired Color Look-Up
Table (CLUT):
Black · Blue · Brown · Green · Grey · Orange · Purple · Red · White · Yellow
✨ Fully Reproducible: Complete provenance tracking of all operations
🎨 10 Color Classes: Biologically-relevant discrete color categories
🔧 Flexible Workflows: From fully automated to completely manual
📊 Evolutionary Integration: Seamless compatibility
with geiger, phytools, pavo
⚡ High-Throughput: Designed for analyzing large image datasets
🔍 Validated CLUT: Non-overlapping HSV color space partitions
charisma depends on spatial R packages that require
system-level libraries. Install these first:
macOS (via Homebrew):
brew install udunits gdal proj geosUbuntu/Debian:
sudo apt-get install libudunits2-dev libgdal-dev libgeos-dev libproj-devFedora/RedHat:
sudo dnf install udunits2-devel gdal-devel geos-devel proj-devel# install.packages("remotes")
remotes::install_github("shawntz/charisma")install.packages("charisma") # Coming soon!library(charisma)
# Load example image
img <- system.file(
"extdata",
"Tangara_fastuosa_LACM60421.png",
package = "charisma"
)
# Basic analysis
result <- charisma(img, threshold = 0.05)
# Visualize
plot(result)
# Interactive mode with manual curation
result_interactive <- charisma(
img,
interactive = TRUE,
threshold = 0.0
)
# Save outputs
result_saved <- charisma(
img,
threshold = 0.05,
logdir = file.path(tempdir(), "charisma_outputs")
)The charisma pipeline consists of three stages:
Uses recolorize
to perform spatial-color binning, removing noisy pixels and creating a
smoothed representation of dominant colors.
Converts RGB cluster centers to HSV and matches against the CLUT
using color2label():
color2label(c(255, 0, 0))    # "red"
color2label(c(0, 0, 255))    # "blue"
color2label(c(255, 255, 0)) # "yellow"In interactive mode:
c(2,3))The charisma object contains:
# Load previous analysis
obj <- system.file("extdata", "Tangara_fastuosa.RDS", package = "charisma")
obj <- readRDS(obj)

# Apply different threshold
result2 <- charisma2(
  obj,
  new.threshold = 0.10
)

# Revert to specific state
result3 <- charisma2(
  obj,
  which.state = "merge",
  state.index = 2
)# Create custom CLUT
my_clut <- charisma::clut # Start with default
# ... modify HSV ranges ...
# Validate completeness
validate(clut = my_clut)
# Use in analysis
result <- charisma(img, clut = my_clut)# Batch process images
results <- lapply(image_paths, function(img) {
charisma(img, threshold = 0.05)
})
# Extract color presence/absence
color_matrix <- do.call(rbind, lapply(results, summarize))
# Phylogenetic analyses with geiger
library(geiger)
fit_er <- fitDiscrete(
phylogeny,
color_matrix[, "blue"],
model = "ER"
)
fit_ard <- fitDiscrete(
phylogeny,
color_matrix[, "blue"],
model = "ARD"
)If you use charisma in your research, please cite:
Schwartz, S.T., Tsai, W.L.E., Karan, E.A., Juhn, M.S., Shultz, A.J., McCormack, J.E., Smith, T.B., and Alfaro, M.E. (2025). charisma: An R package to perform reproducible color characterization of digital images for biological studies. (In Review).
📧 Email: shawn.t.schwartz@gmail.com
charisma integrates with:
recolorize
(Weller et al. 2024) -
Image preprocessingpavo (Maia et al. 2019) -
Color pattern geometryMIT © 2025 Shawn T. Schwartz