![]()
![]()
![]()
![]()
An R-package for analyzing natural language implementing Differential
Language Analysis using words, phrases and topics.
Check out
our tutorial paper: Multiple Methods for
Visualizing Human Language: A Tutorial for Social and Behavioural
Scientists. If you use the topics package, please cite this tutorial
in your work.
The topics package is part of the
R Language Analysis Suite, including talk,
text and topics.
talk transforms
voice recordings into text, audio features, or embeddings.text provides
many language tasks such as converting digital text into word
embeddings.talk and text offer
access to Large Language Models from Hugging Face.topics
visualizes language patterns into words, phrases or topics to generate
psychological insights. topics package supports
the text package in analysing and visualizing topics from
BERTtopics.
When using the topics package, please cite:
Ackermann L., Zhuojun G. & Kjell O.N.E. (2024). An R-package for
visualizing text in topics. https://github.com/theharmonylab/topics.
DOI:zenodo.org/records/11165378.
The topics package uses JAVA, which is another programming
language. Please start by downloading and installing it from
www.java.com/en/download/. Then open R and run:
install.packages("devtools")
devtools::install_github("theharmonylab/topics")

# if you run in to any installation problem, try installing rJava first.

# Before open the library, consider setting this option (can increase 5000);  without it the code may ran out of memory
options(java.parameters = "-Xmx5000m")The pipeline is composed of the following steps:
1. Data Preprocessing
The data preprocessing
converts the data into a document term matrix (DTM) and removes
stopwords, punctuation, etc. which is the data format needed for the LDA
model.
2. Model Training
The model training step trains
the LDA model on the DTM with a number of iterations and predefined
amount of topics.
3. Model Inference
The model inference step uses
the trained LDA model to infer the topic term distribution of the
documents.
4. Statistical Analysis
The analysis includes
the methods like linear regression, binary regression, ridge regression
or correlation to analyze the relationship between the topics and the
prediction variable. It is possible to control for a number of variables
and to adjust the p-value for multiple comparisons.
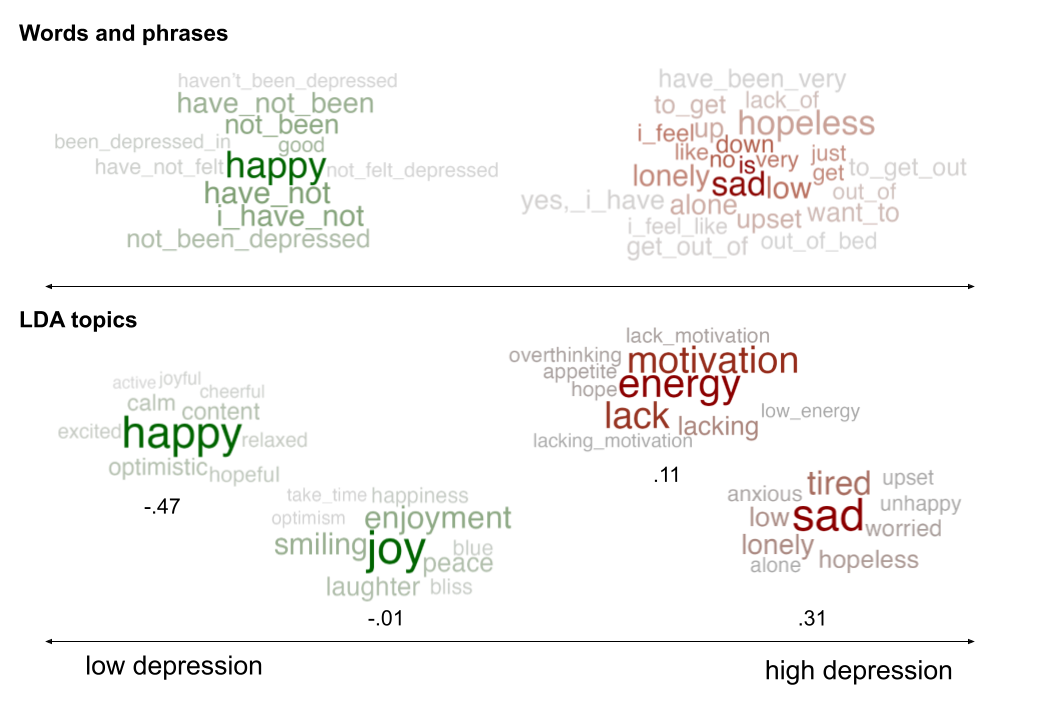
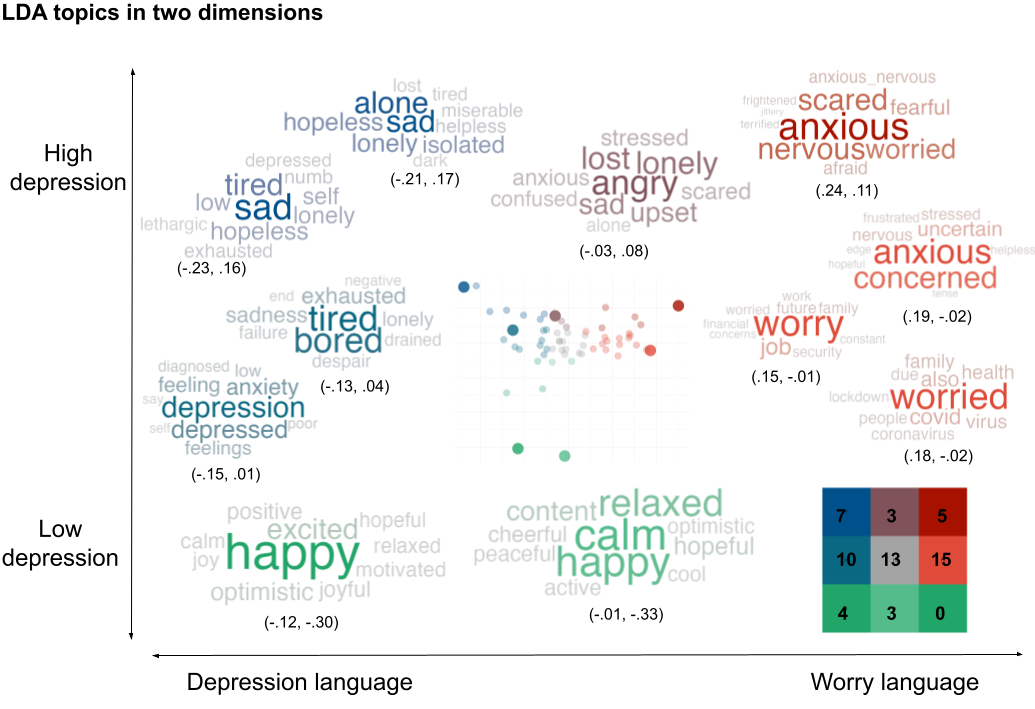
5. Visualization
The visualization step creates
wordclouds of the significant topics found by the statistical
analysis.