ernm packageThis is an R package to fit Exponential-Family Random Network Models (ERNM).
Exponential-family Random Graph Models (ERGM) and Gibbs Fields are special cases of ERNMs and can also be estimated with the package. The package fits both fully and partially observed network data.
The stochastic processes generating complex social networks often
involve stochastic nodal and dyadic variables that are endogenously
related to the tie variables. While exponential-family random graph
models (ERGMs) have been very successful in modeling social networks
with exogenous covariates, they are often misspecified for networks
where some covariates are stochastic. Exponential-family random network
models (ERNMs) retain the desirable properties of ERGM, but allow the
joint modeling of tie variables and covariates. For more information
about the ergm package see
here.
ernm is an open-source R package which enables ERNM to
be fit to real-world network data. The package implements
likelihood-based inference, goodness-of-fit assessment and simulation of
ERNM. It also implements analogs of some of the many of the extensions
that have been developed for ERGM, including tapered models.
The package was developed by Ian E. Fellows with support from Duncan A. Clark and Mark S. Handcock.
The package is available on CRAN and can be installed using
install.packages("ernm")To install the latest development version from GitHub, the best way it to use git to create a local copy and install it as usual from there. If you just want to install it, you can also use:
# If devtools is not installed:
# install.packages("devtools")

devtools::install_github("fellstat/ernm")We will demonstrate simple use of the package using a real network. First we load package and network data.
library(ernm)
data(dutch_school)
dutch_school is a list of four networks collected in
Knecht (2008). There are of students from a single class in the dataset
collected at four time points at intervals of three months. The students
are aged 11-13. Each node has values for age, ethnicity, religion and
sex, as these are likely exogenous to the social process, we regard them
as fixed for the purpose of this demonstration of analysis. There are
also values 1 − 5 for alcohol use and delinquency from school, which we
process as binary variables, with 1 indicating any alcohol or
delinquency behavior and 0 being none. Drinking alcohol and delinquency
are likely endogenous to the social process of friendship within the
class, thus, ERNM which treats them as such, is a suitable model. These
variables are included as vertex attributes of the networks. We focuse
on the network at the third time point.
As ERNM accounts for both stochastic edges and nodal covariates, network statistics can incorporate both. We analyse the 4th network, the last network collected in the dataset, with the logic that the endogenous social process in this case has hasd longest to reach some kind stable state. We include edges, geometrically weighted edgewise shared partner (GWESP) and geometrically weighted degree (GWDEG) terms, with a fixed decay parameter. This is analogous to an ERGM analysis where the GWESP term accounts for transitivity in the network and the GWDEG term accounts for social popularity effects. The nodeMatch terms are the same as in ERGM, we note that these are applicable for both random nodal covariates and fixed nodal covariates.
There are other important control parameters, that are described in Fellows, Clark and Handcock (2025).
The syntax is very similar to ERGM syntax with some slightly differently names terms for example nodeMatch in place of the ergm package nodematch. Full details can be found in Fellows, Clark and Handcock (2025) and the package documentation. Note that nodal covariates after the | symbol are regarded as random. Currently only discrete random variables are supported for nodal covariates.
We can make a quick visualization of the network, where the number of sides of the node is proportional to the level of alchol use and the color is black if they do not use alchol and black if they do.
gplot(net, gmode="graph",
   vertex.sides=as.numeric(net %v% "alc")+3,
   vertex.col=as.numeric(net %v% "alc_bin")+1 )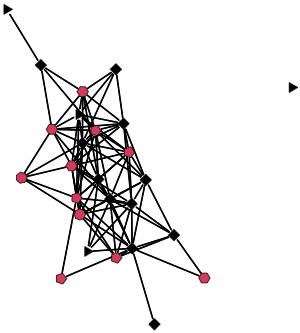
ernm() functionThe function that performs the overall maximum likelihood fit is
called ernm(). This may take a few seconds to run.
set.seed(1)
net <- dutch_school[[3]]
model_1 <- ernm(net ~ edges +
gwesp(0.5) +
gwdegree(0.5) +
nodeCount('alc_bin') +
nodeCount('delinq_bin') +
nodeMatch('sex') +
nodeMatch('etnicity') +
nodeMatch('religion') +
nodeMatch('delinq_bin') +
nodeMatch('alc_bin') |
delinq_bin + alc_bin,
nodeSamplingPercentage = 0.5,
verbose = FALSE,
maxIter = 100,
tapered = FALSE)

model_1
## ERNM Model
## Domain:
## Random graph = TRUE, Random variables = alc_bin delinq_bin
## edges gwesp.0.5 gwdegree.0.5 nodecount.alc_bin.1
## Parameters -7.075778 2.797428 0.3961009 -0.4465418
## Mean Values 96.821500 149.391420 39.4700129 11.0641000
## nodecount.delinq_bin.1 nodematch.sex nodematch.etnicity
## Parameters 0.09320678 1.029239 0.1358498
## Mean Values 14.87130000 73.665600 80.2682000
## nodematch.religion nodematch.delinq_bin nodematch.alc_bin
## Parameters 0.5576215 0.1920406 -0.1363803
## Mean Values 47.0953000 58.1278000 46.6376000Here is a summary of the results of the fit:
summary.ernm(model_1)## theta se z p.value
## edges -7.07577801 1.2419221 -5.6974409 1.216191e-08
## gwesp.0.5 2.79742793 0.7020541 3.9846332 6.758444e-05
## gwdegree.0.5 0.39610090 0.8763979 0.4519647 6.512944e-01
## nodecount.alc_bin.1 -0.44654185 0.5327333 -0.8382090 4.019133e-01
## nodecount.delinq_bin.1 0.09320678 0.2383669 0.3910224 6.957807e-01
## nodematch.sex 1.02923870 0.2153215 4.7800081 1.752881e-06
## nodematch.etnicity 0.13584979 0.2468343 0.5503684 5.820667e-01
## nodematch.religion 0.55762146 0.2112683 2.6393991 8.305313e-03
## nodematch.delinq_bin 0.19204064 0.1068871 1.7966680 7.238833e-02
## nodematch.alc_bin -0.13638033 0.2364640 -0.5767489 5.641091e-01
##
## Information Criteria:
## AIC BIC
## 196.1945 234.8024There is much more that can be down and we refer you to Fellows, Clark and Handcock (2025) for explanation and details.
Here is an assessment of the goodness-of-fit to the edgewise shared partner 1 statistic:
# Create histograms of summary statistics
gof_1 = ernm_gof(list(model_1=model_1),
observed_network = net,
style = 'histogram',
net ~ esp(1),
scale = 'free',
print = TRUE,
n_sim = 1000
)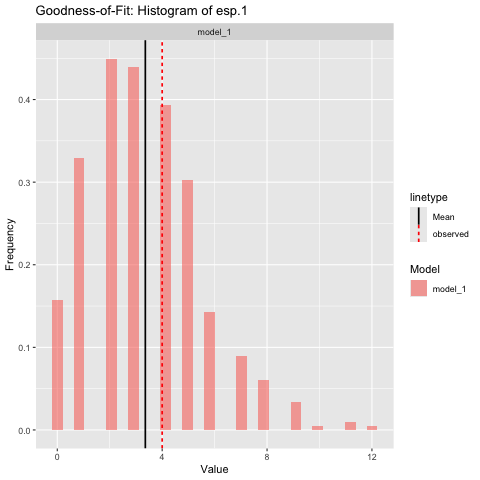
We see that the fit to the statistic is good.
Again, this is just a start and we refer you to Fellows, Clark and Handcock (2025) for explanation and details.
The preferred method for users to use their own custom statistics is
to create a package as in the example extension package in
inst/examplePackage.
Users can then directly call register*Statistic for
statistics that may be useful for the wider community.
They can be integrated into the ernm package the
following workflow. This workflow also forces users to adequately test
their statistics, which may be beneficial, especially for complex
statistics.
inst/include/stats.h file. This is where the
calculation of the statistics defined. Note for ernm the
dyadUpdate and discreteVertexUpdate and
continVertexUpdate methods are crucial for the performance
of the MCMC routine required to fit ERNMs.src/statController.cpp
filetest_stat.cpp file. This will
then be run when the package is built to ensure the statistic is safe on
the C++ endR tests in tests/testthat/test-stats.R
to actually check the value of the statistic is as expected on the
R end.After these steps you should be able to add new statistics to your
local fork of the ernm package, and then submit a pull
request to have those statistics integrated into the ernm
package for others to use.
Please use the GitHub repository to report bugs or request features: https://github.com/fellstat/ernm
See the following papers for more information and examples:
Fellows, I. E. and Handcock, M. S. (2012). Exponential-family random network models. https://doi.org/10.48550/arXiv.1208.0121
Fellows, I. E., Clark, D. A. and Handcock, M. S. (2025). R package ernm: Exponential-family Random Network Models. Manuscript.
Hunter, D. R., Handcock, M. S., Butts, C. T., Goodreau, S. M., and Morris, M. (2008). ergm: A package to fit, simulate and diagnose exponential-family models for networks. Journal of Statistical Software, 24(3), 1–29. https://doi.org/10.18637/jss.v024.i03
Knecht, A. B. (2008). Friendship selection and friends’ influence: Dynamics of networks and actor attributes in early adolescence (Doctoral dissertation, University of Utrecht, Utrecht, The Netherlands). 134 pages. https://dspace.library.uu.nl/handle/1874/25950
Wang, Z., Fellows, I. E., & Handcock, M. S. (2024). Understanding networks with exponential-family random network models. Social Networks, 78, 81–91. https://doi.org/10.1016/j.socnet.2023.07.003