FRApp is an R package and an R-based Shiny application providing a user-friendly interactive interface to streamline the data analysis derived by fitting nonlinear mixed-effects regression models with an asymptotic exponential functional relationship on data with a hierarchical structure. The package provides a comprehensive suite of tools tailored for efficient data analysis and visualization.
The package includes data from Fluorescence Recovery After Photobleaching (FRAP) experiments on actin dynamics in dendritic spines.
To explore all the functionalities of FRApp, a comprehensive guide is available in a dedicated vignette.
To use the FRApp application first download and install R and RStudio from posit.co.
You can install the package from the CRAN executing the following commands from the RStudio console:
install.packages("FRApp")You can install the development version of FRApp from GitHub with:
# install.packages("devtools")
devtools::install_github("gioiadc/FRApp")To load the package and make the functions available to be used run the command:
library(FRApp)You must execute this command every time you restart RStudio.
To launch the Shiny app, copy and paste the following code in the console:
FRApp()The application opens automatically in the browser.
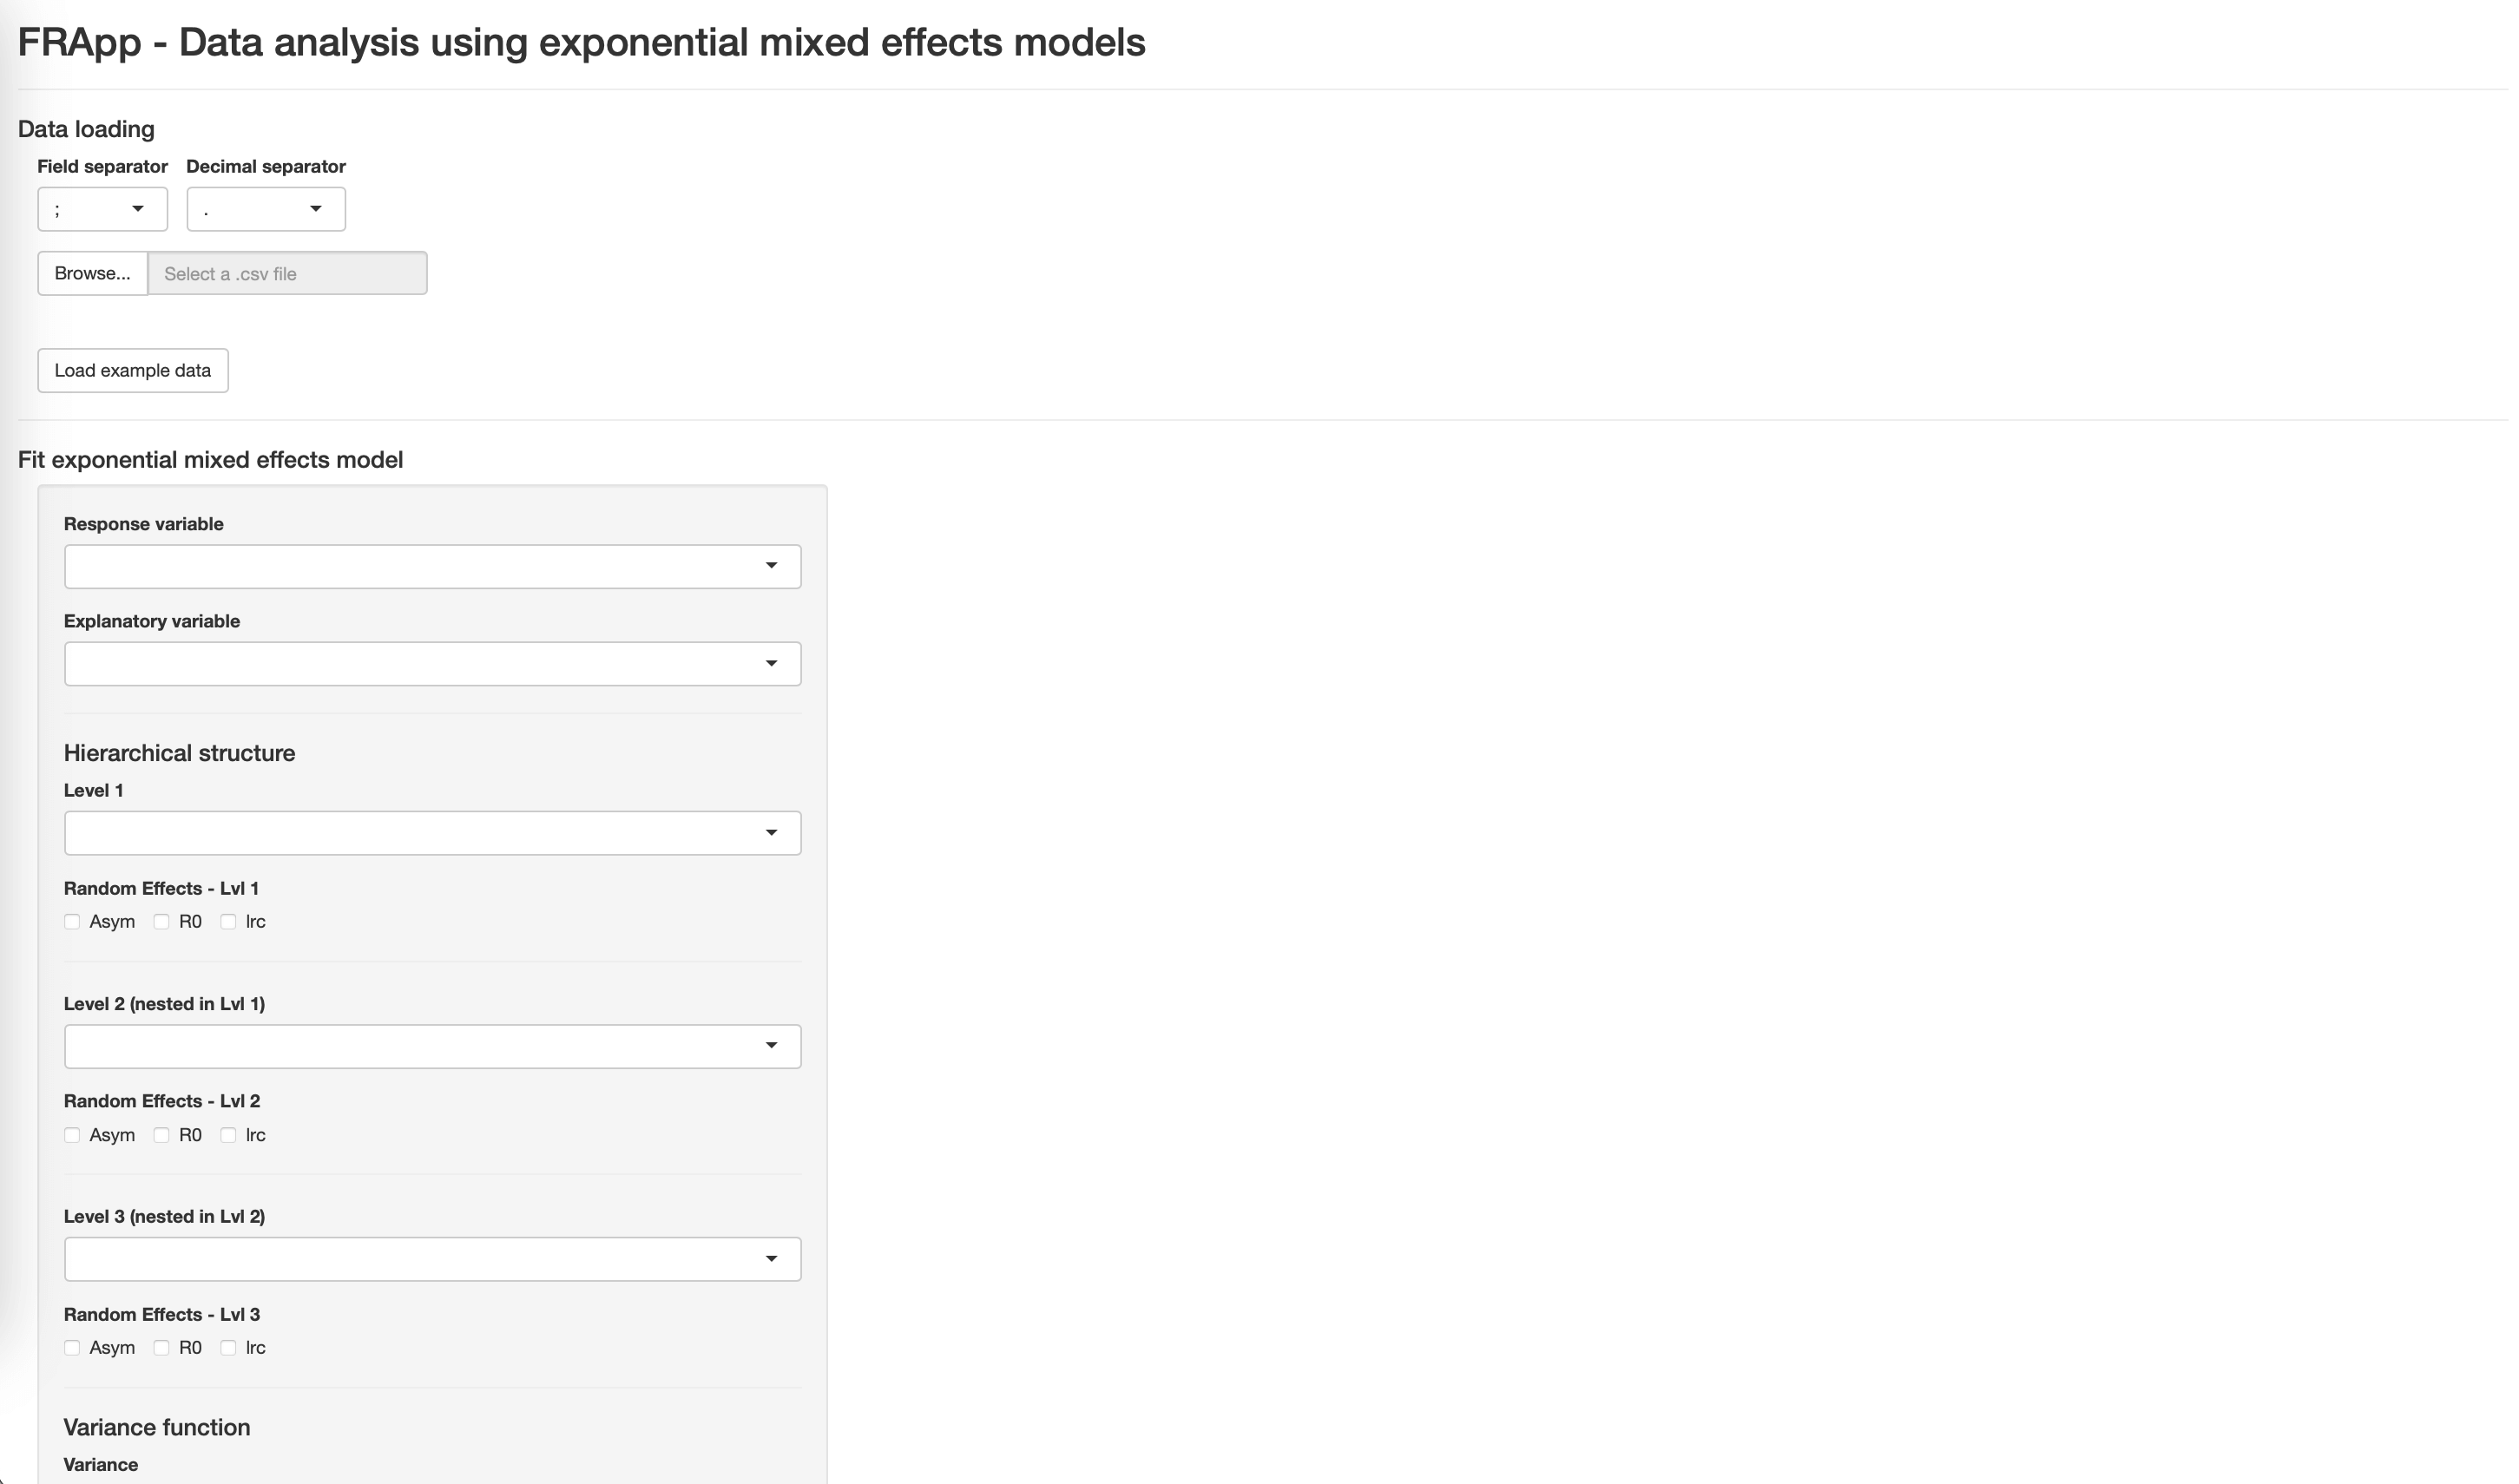
FRApp allows you to:
load the data
estimate and compare exponential mixed-effects models
print a model report
export the data and the model corresponding objects.
The Fit the model button allows you to estimate the model. At the end of the estimation process, the following objects will appear on the right side of the application:
summary information on the model
diagnostic plots: scatterplot of residuals vs. estimated values and quantile-quantile plot of the residuals
approximate 95% confidence intervals of the parameters of interest.
Model fitting is performed with the function
nlme.
You can save models for model comparison with the button Add to model list in the Model list section. Saved models must have different names. When multiple models are saved, the table at the bottom of the page displays comparisons between the saved models using AIC, BIC, and likelihood ratio test criteria.
The Reset model list button allows you to delete the saved models from the list.
From the drop-down menu in the Download section, it is possible to select a model saved in the model list and download a report and some model’s objects.
In the Download section, the Report button allows you to export the results printed in the application (model summary, residual graphs, and intervals) into a PDF document.
The RData button allows you to export an RData file containing six objects:
data: the dataset in the format used for the analysis
fit: the output of the estimated model
pred: the values estimated by the model
CI: the approximate 95% confidence intervals
resid: the residuals of the model
raneff: the random effects available at the different hierarchical levels.
As a reference for the construction of the model and the different options to specify, we refer to the book: Pinheiro, J., & Bates, D. (2006). Mixed-effects models in S and S-PLUS. Springer science & business media.
As a reference for the FRAP data analysis example: Di Credico, G., Pelucchi, S., Pauli, F. et al. Nonlinear mixed-effects models to analyze actin dynamics in dendritic spines. Scientific Reports 15, 5790 (2025). https://doi.org/10.1038/s41598-025-87154-w