PlotNormTest provides graphical techniques to find evidence of non-normality of a multivariate dataset.
You can install the development version of PlotNormTest from GitHub with:
# install.packages("devtools")
devtools::install_github("HuongTran53/PlotNormTest")This is a basic example which shows you how to solve a common problem:
library(PlotNormTest)
set.seed(123)
x <- MASS::mvrnorm(1000, rep(0, 5), diag(5))d3hCGF_plot(x); title("Using third derivatives of CGF")
#> [1] "accept"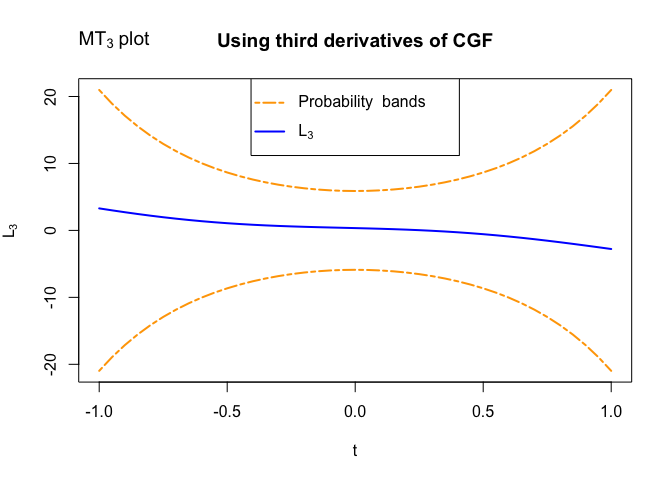
d4hCGF_plot(x); title("Using fourth derivatives of CGF")
#> [1] "accept"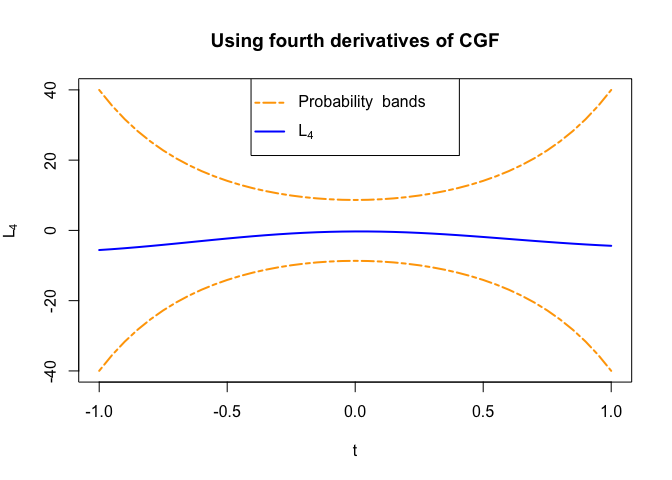
df <- Multi.to.Uni(x)
qqnorm(df$x.new, main = "Transfromation to nearly independent unvariate sample, Q-Q plot"); abline(0, 1)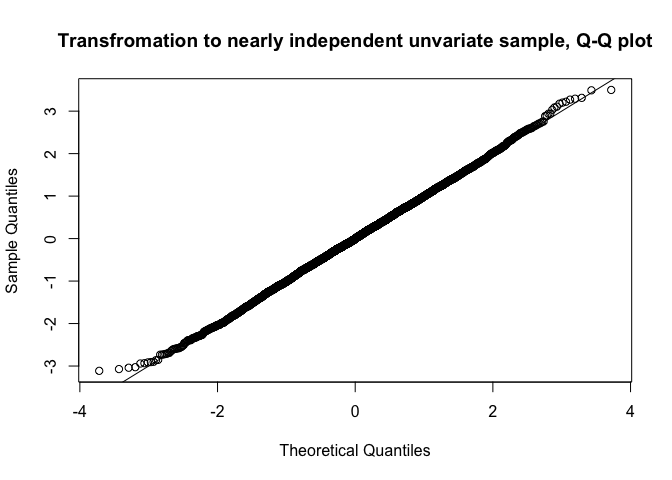
# Maximum skewness under linear transformation
linear_transform(x, method = "skewness")$max_result
#> [1] 0.01160368